Metrics for CyberArk Certificate Manager Operator
Overview
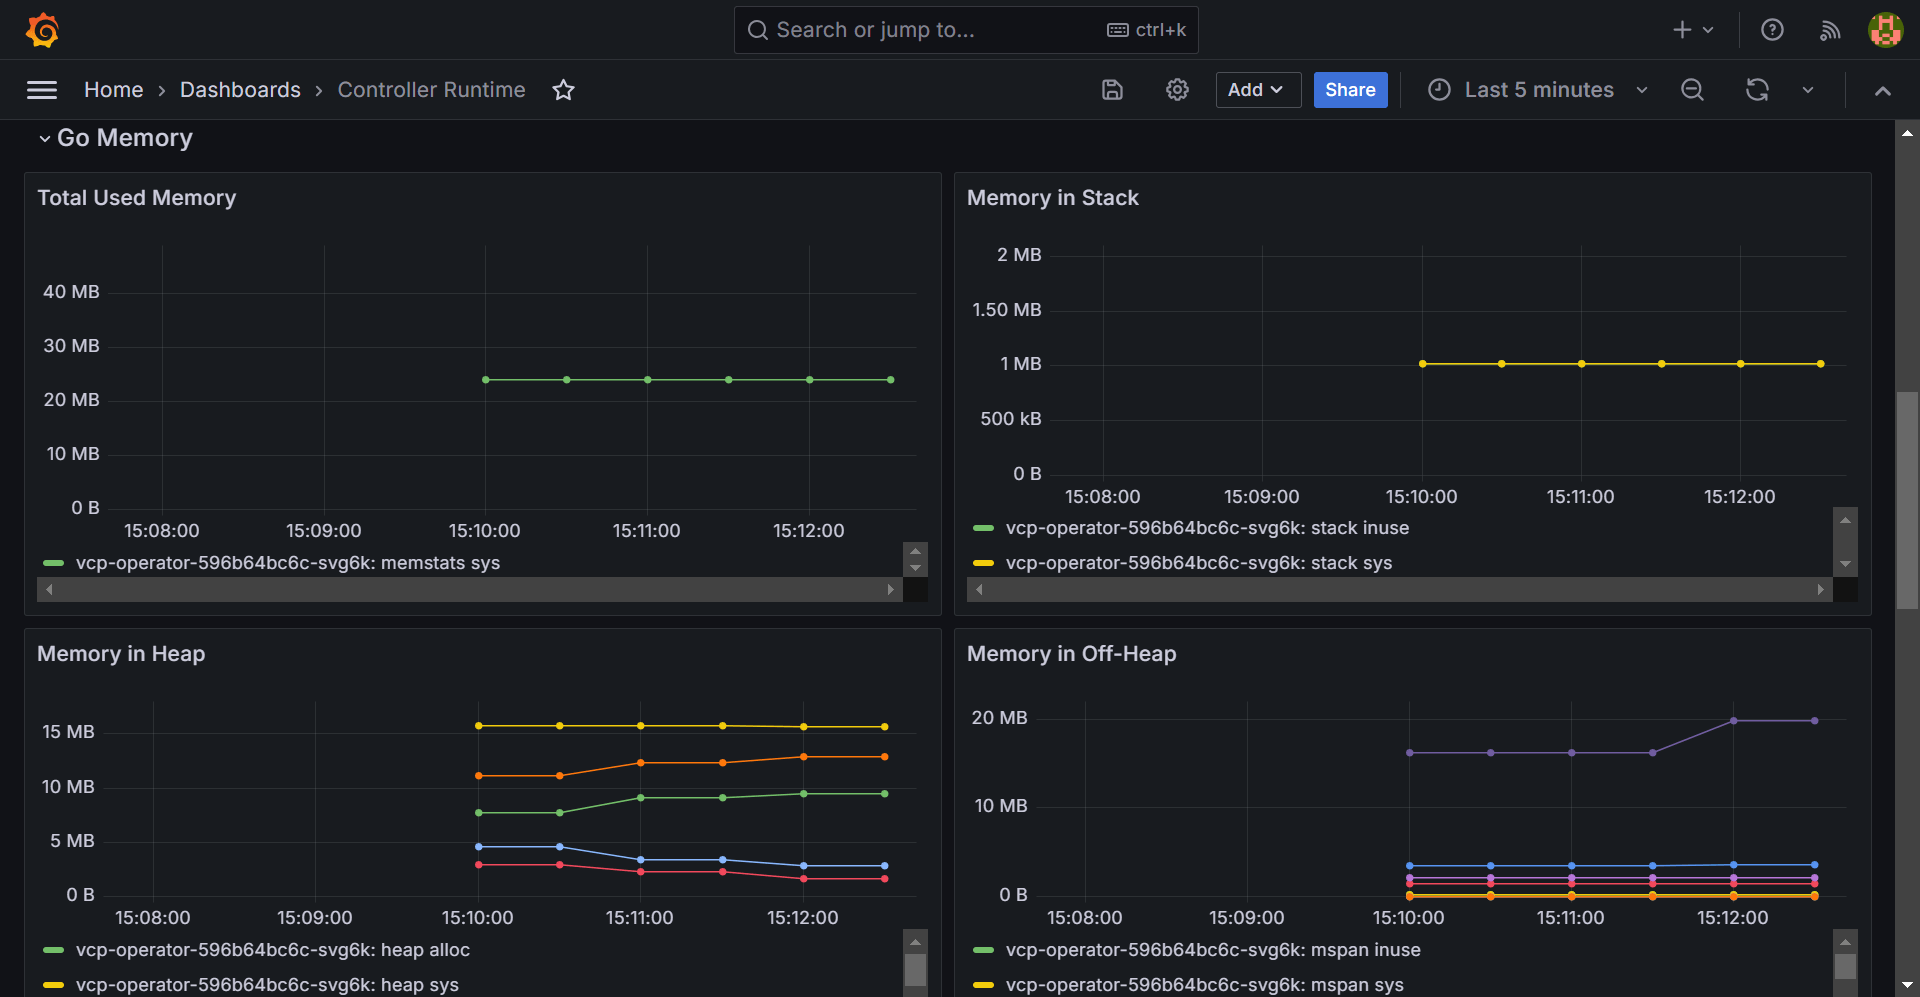
CyberArk Certificate Manager Operator for Red Hat OpenShift (formerly known as Venafi Control Plane Operator) exposes operational and usage telemetry metrics suitable for popular monitoring solutions, enabling alerts on important operational states. The graphic below shows an example of a Grafana dashboard for CyberArk Certificate Manager Operator.
Info
The screenshot above shows a controller-runtime dashboard provided by the cluster-api project. The dashboard can be used to monitor any controller-runtime based workload. The CyberArk Certificate Manager Operator uses controller-runtime and exports all the default controller runtime metrics.
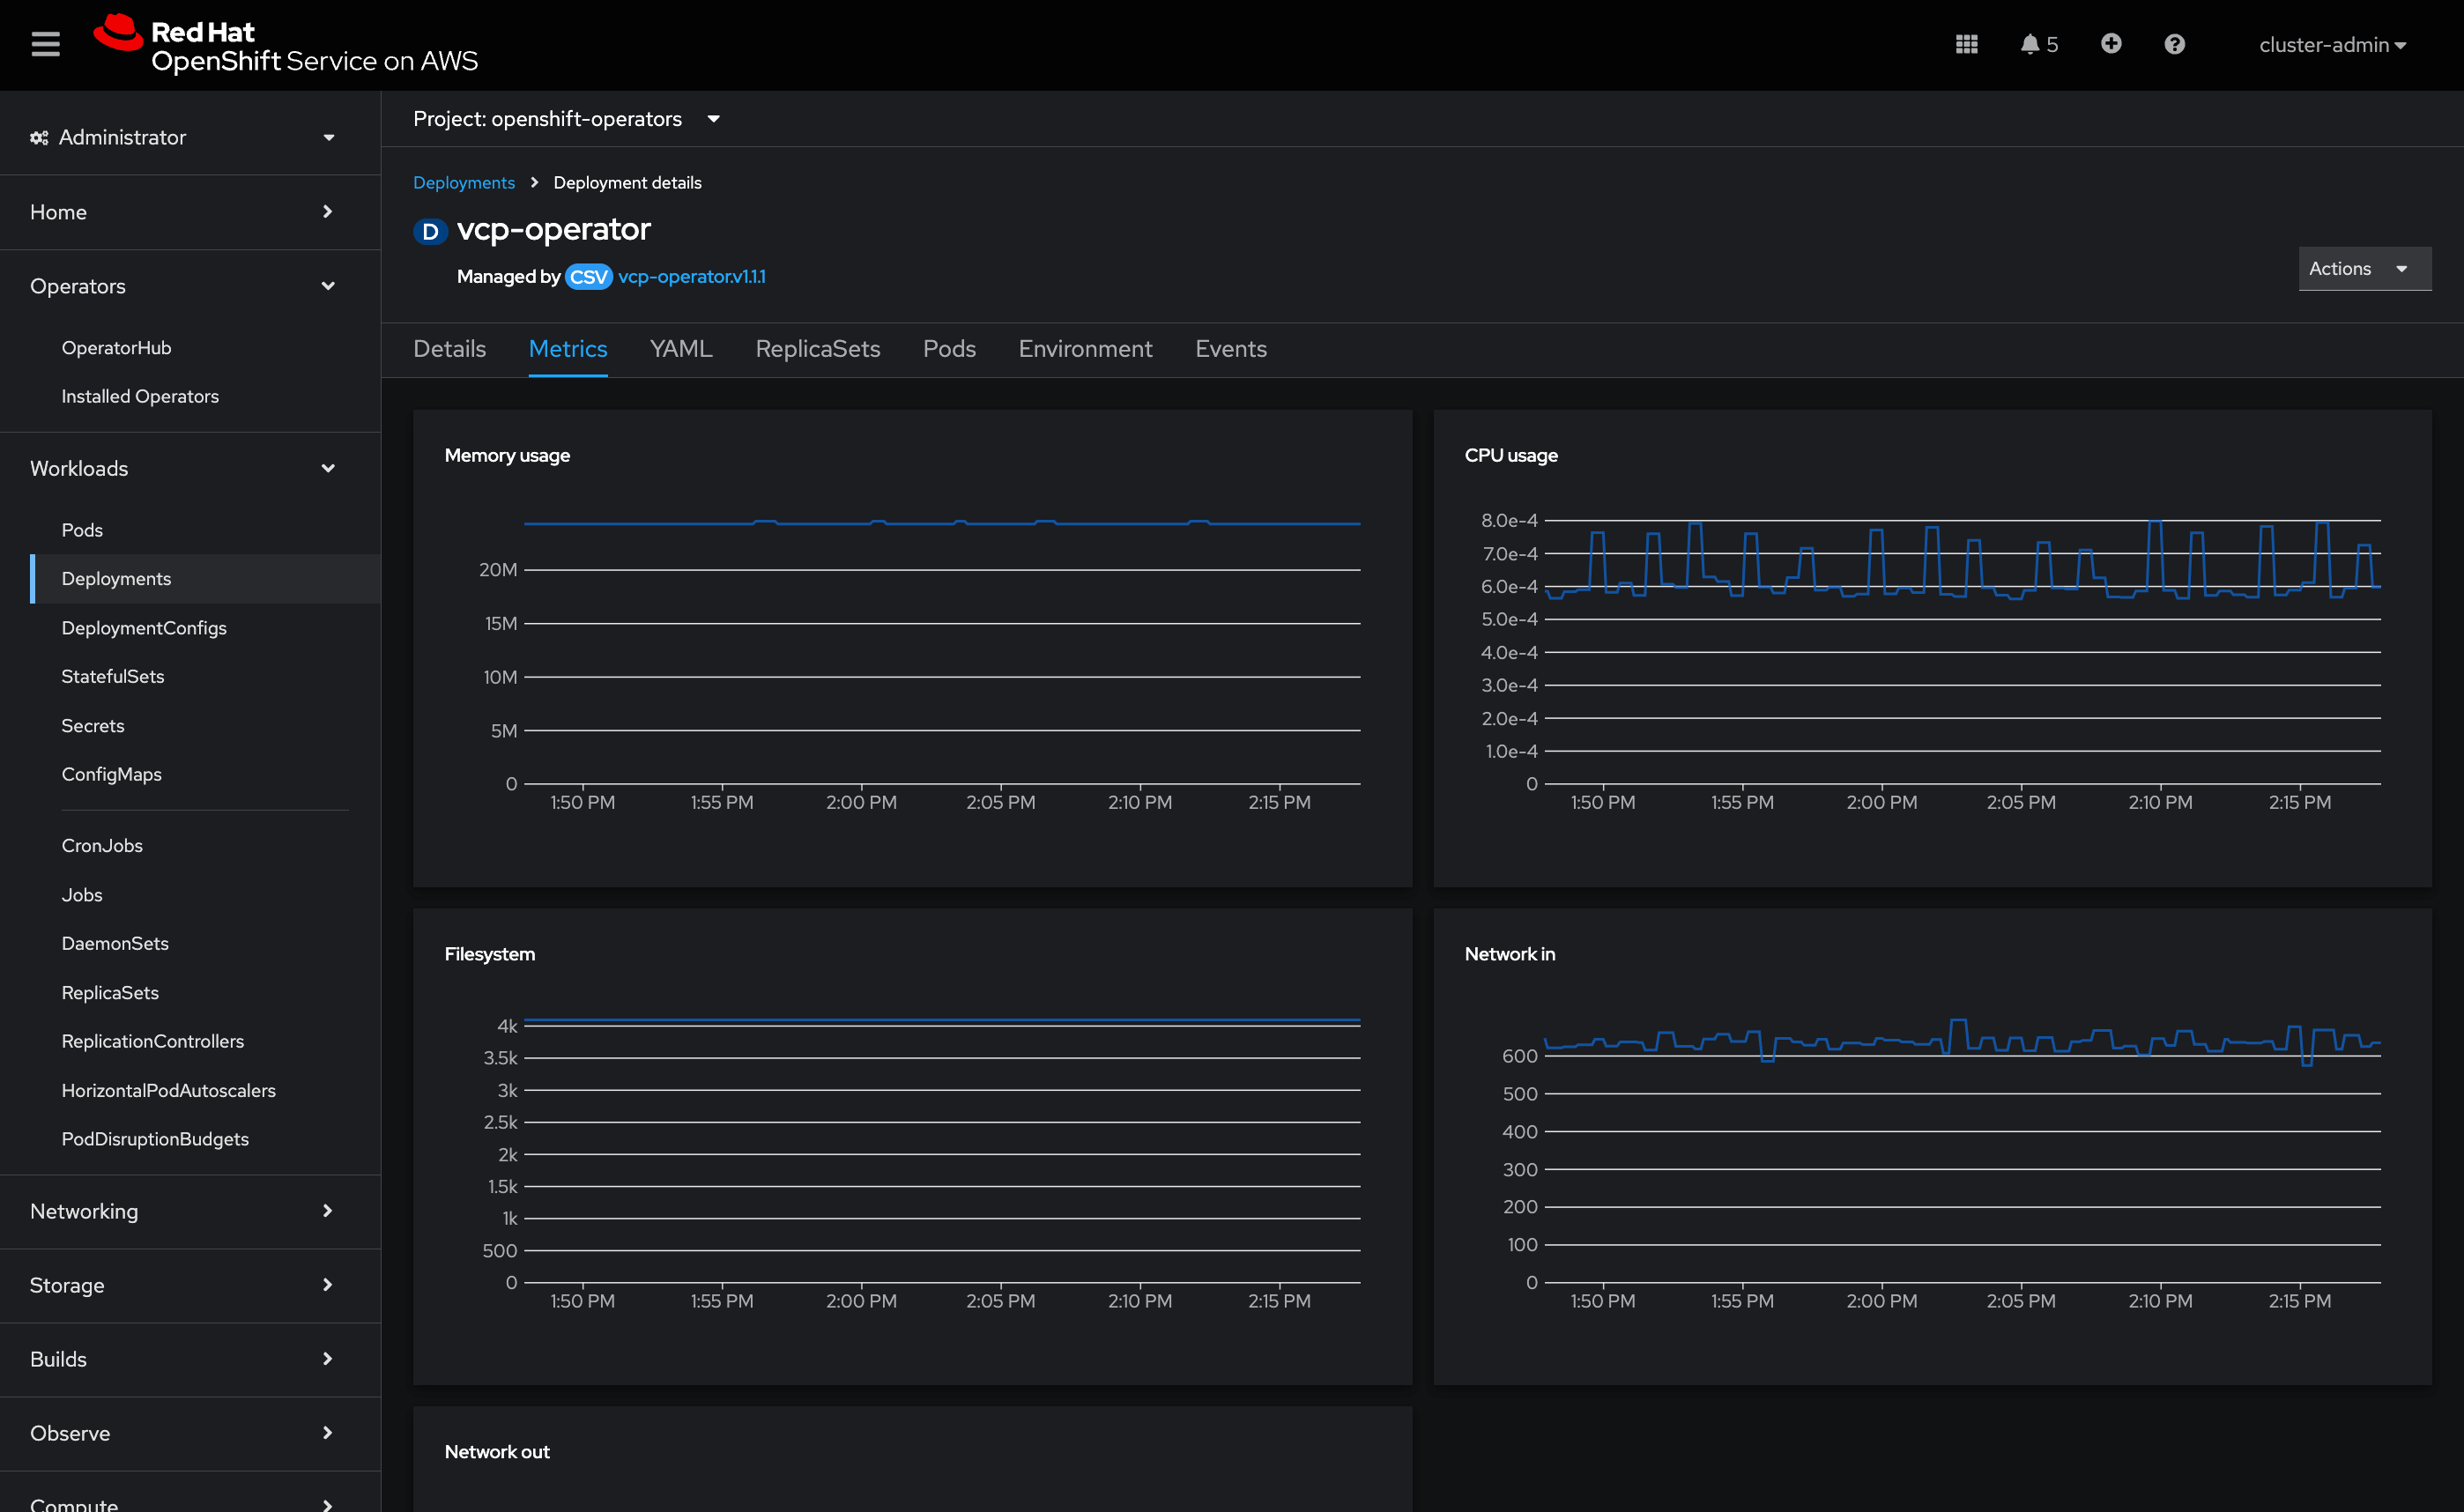
CPU and memory metrics
CPU and memory metrics are provided by OpenShift.
PodMonitor for Prometheus Operator
If you use Prometheus Operator, the following PodMonitor resource will configure Prometheus to scrape the metrics of the CyberArk Certificate Manager Operator:
apiVersion: monitoring.coreos.com/v1
kind: PodMonitor
metadata:
  name: vcp-operator
  namespace: venafi
  labels:
    prometheus: default
spec:
  jobLabel: app
  selector:
    matchLabels:
      app: vcp-operator
  podMetricsEndpoints:
    - targetPort: 9402
      path: /metrics
      interval: 60s
      scrapeTimeout: 30s
      honorLabels: false
Reference
All metrics are formatted in Prometheus format. They can be accessed by HTTP on TCP port 9402, at the standard /metrics path.
You can query the metrics endpoint and fetch the current metrics data in Prometheus format as follows:
POD_NAME=$(oc get pod -n venafi -l app=vcp-operator -o jsonpath='{ .items[0].metadata.name }')
oc get --raw "/api/v1/namespaces/venafi/pods/${POD_NAME}:9402/proxy/metrics" | grep -A1 'HELP'
Full metrics reference
Here are the metrics that CyberArk Certificate Manager Operator exports:
# HELP certwatcher_read_certificate_errors_total Total number of certificate read errors
# TYPE certwatcher_read_certificate_errors_total counter
--
# HELP certwatcher_read_certificate_total Total number of certificate reads
# TYPE certwatcher_read_certificate_total counter
--
# HELP controller_runtime_active_workers Number of currently used workers per controller
# TYPE controller_runtime_active_workers gauge
--
# HELP controller_runtime_max_concurrent_reconciles Maximum number of concurrent reconciles per controller
# TYPE controller_runtime_max_concurrent_reconciles gauge
--
# HELP controller_runtime_reconcile_errors_total Total number of reconciliation errors per controller
# TYPE controller_runtime_reconcile_errors_total counter
--
# HELP controller_runtime_reconcile_time_seconds Length of time per reconciliation per controller
# TYPE controller_runtime_reconcile_time_seconds histogram
--
# HELP controller_runtime_reconcile_total Total number of reconciliations per controller
# TYPE controller_runtime_reconcile_total counter
--
# HELP go_gc_duration_seconds A summary of the pause duration of garbage collection cycles.
# TYPE go_gc_duration_seconds summary
--
# HELP go_goroutines Number of goroutines that currently exist.
# TYPE go_goroutines gauge
--
# HELP go_info Information about the Go environment.
# TYPE go_info gauge
--
# HELP go_memstats_alloc_bytes Number of bytes allocated and still in use.
# TYPE go_memstats_alloc_bytes gauge
--
# HELP go_memstats_alloc_bytes_total Total number of bytes allocated, even if freed.
# TYPE go_memstats_alloc_bytes_total counter
--
# HELP go_memstats_buck_hash_sys_bytes Number of bytes used by the profiling bucket hash table.
# TYPE go_memstats_buck_hash_sys_bytes gauge
--
# HELP go_memstats_frees_total Total number of frees.
# TYPE go_memstats_frees_total counter
--
# HELP go_memstats_gc_sys_bytes Number of bytes used for garbage collection system metadata.
# TYPE go_memstats_gc_sys_bytes gauge
--
# HELP go_memstats_heap_alloc_bytes Number of heap bytes allocated and still in use.
# TYPE go_memstats_heap_alloc_bytes gauge
--
# HELP go_memstats_heap_idle_bytes Number of heap bytes waiting to be used.
# TYPE go_memstats_heap_idle_bytes gauge
--
# HELP go_memstats_heap_inuse_bytes Number of heap bytes that are in use.
# TYPE go_memstats_heap_inuse_bytes gauge
--
# HELP go_memstats_heap_objects Number of allocated objects.
# TYPE go_memstats_heap_objects gauge
--
# HELP go_memstats_heap_released_bytes Number of heap bytes released to OS.
# TYPE go_memstats_heap_released_bytes gauge
--
# HELP go_memstats_heap_sys_bytes Number of heap bytes obtained from system.
# TYPE go_memstats_heap_sys_bytes gauge
--
# HELP go_memstats_last_gc_time_seconds Number of seconds since 1970 of last garbage collection.
# TYPE go_memstats_last_gc_time_seconds gauge
--
# HELP go_memstats_lookups_total Total number of pointer lookups.
# TYPE go_memstats_lookups_total counter
--
# HELP go_memstats_mallocs_total Total number of mallocs.
# TYPE go_memstats_mallocs_total counter
--
# HELP go_memstats_mcache_inuse_bytes Number of bytes in use by mcache structures.
# TYPE go_memstats_mcache_inuse_bytes gauge
--
# HELP go_memstats_mcache_sys_bytes Number of bytes used for mcache structures obtained from system.
# TYPE go_memstats_mcache_sys_bytes gauge
--
# HELP go_memstats_mspan_inuse_bytes Number of bytes in use by mspan structures.
# TYPE go_memstats_mspan_inuse_bytes gauge
--
# HELP go_memstats_mspan_sys_bytes Number of bytes used for mspan structures obtained from system.
# TYPE go_memstats_mspan_sys_bytes gauge
--
# HELP go_memstats_next_gc_bytes Number of heap bytes when next garbage collection will take place.
# TYPE go_memstats_next_gc_bytes gauge
--
# HELP go_memstats_other_sys_bytes Number of bytes used for other system allocations.
# TYPE go_memstats_other_sys_bytes gauge
--
# HELP go_memstats_stack_inuse_bytes Number of bytes in use by the stack allocator.
# TYPE go_memstats_stack_inuse_bytes gauge
--
# HELP go_memstats_stack_sys_bytes Number of bytes obtained from system for stack allocator.
# TYPE go_memstats_stack_sys_bytes gauge
--
# HELP go_memstats_sys_bytes Number of bytes obtained from system.
# TYPE go_memstats_sys_bytes gauge
--
# HELP go_threads Number of OS threads created.
# TYPE go_threads gauge
--
# HELP leader_election_master_status Gauge of if the reporting system is master of the relevant lease, 0 indicates backup, 1 indicates master. 'name' is the string used to identify the lease. Please make sure to group by name.
# TYPE leader_election_master_status gauge
--
# HELP process_cpu_seconds_total Total user and system CPU time spent in seconds.
# TYPE process_cpu_seconds_total counter
--
# HELP process_max_fds Maximum number of open file descriptors.
# TYPE process_max_fds gauge
--
# HELP process_open_fds Number of open file descriptors.
# TYPE process_open_fds gauge
--
# HELP process_resident_memory_bytes Resident memory size in bytes.
# TYPE process_resident_memory_bytes gauge
--
# HELP process_start_time_seconds Start time of the process since unix epoch in seconds.
# TYPE process_start_time_seconds gauge
--
# HELP process_virtual_memory_bytes Virtual memory size in bytes.
# TYPE process_virtual_memory_bytes gauge
--
# HELP process_virtual_memory_max_bytes Maximum amount of virtual memory available in bytes.
# TYPE process_virtual_memory_max_bytes gauge
--
# HELP rest_client_requests_total Number of HTTP requests, partitioned by status code, method, and host.
# TYPE rest_client_requests_total counter
--
# HELP workqueue_adds_total Total number of adds handled by workqueue
# TYPE workqueue_adds_total counter
--
# HELP workqueue_depth Current depth of workqueue
# TYPE workqueue_depth gauge
--
# HELP workqueue_longest_running_processor_seconds How many seconds has the longest running processor for workqueue been running.
# TYPE workqueue_longest_running_processor_seconds gauge
--
# HELP workqueue_queue_duration_seconds How long in seconds an item stays in workqueue before being requested
# TYPE workqueue_queue_duration_seconds histogram
--
# HELP workqueue_retries_total Total number of retries handled by workqueue
# TYPE workqueue_retries_total counter
--
# HELP workqueue_unfinished_work_seconds How many seconds of work has been done that is in progress and hasn't been observed by work_duration. Large values indicate stuck threads. One can deduce the number of stuck threads by observing the rate at which this increases.
# TYPE workqueue_unfinished_work_seconds gauge
--
# HELP workqueue_work_duration_seconds How long in seconds processing an item from workqueue takes.
# TYPE workqueue_work_duration_seconds histogram