Metrics for CyberArk enterprise components for Kubernetes
Gaining operational and usage insights into the CyberArk enterprise components for Kubernetes is important. Platform teams need to be aware of conditions that can indicate potential performance implications to production users or security issues which require immediate attention.
The CyberArk enterprise components for Kubernetes provide operational and usage telemetry metrics that can be consumed by popular solutions for monitoring and alerting on key operational conditions.
Platform teams can monitor CyberArk enterprise component telemetry by leveraging the monitoring and alerting toolkit Prometheus and visualizing metric data through the Grafana platform. Accessible at the standard /metrics path, this data is provided by the controller component's configured HTTP port.
The metrics are exposed by the following components:
- cert-manager
- Enterprise Issuer for CyberArk Certificate Manager
- Enterprise Approver Policy
- Approver Policy
- Trust Manager
- CSI Driver
- CSI Driver for SPIFFE
- Discovery Agent
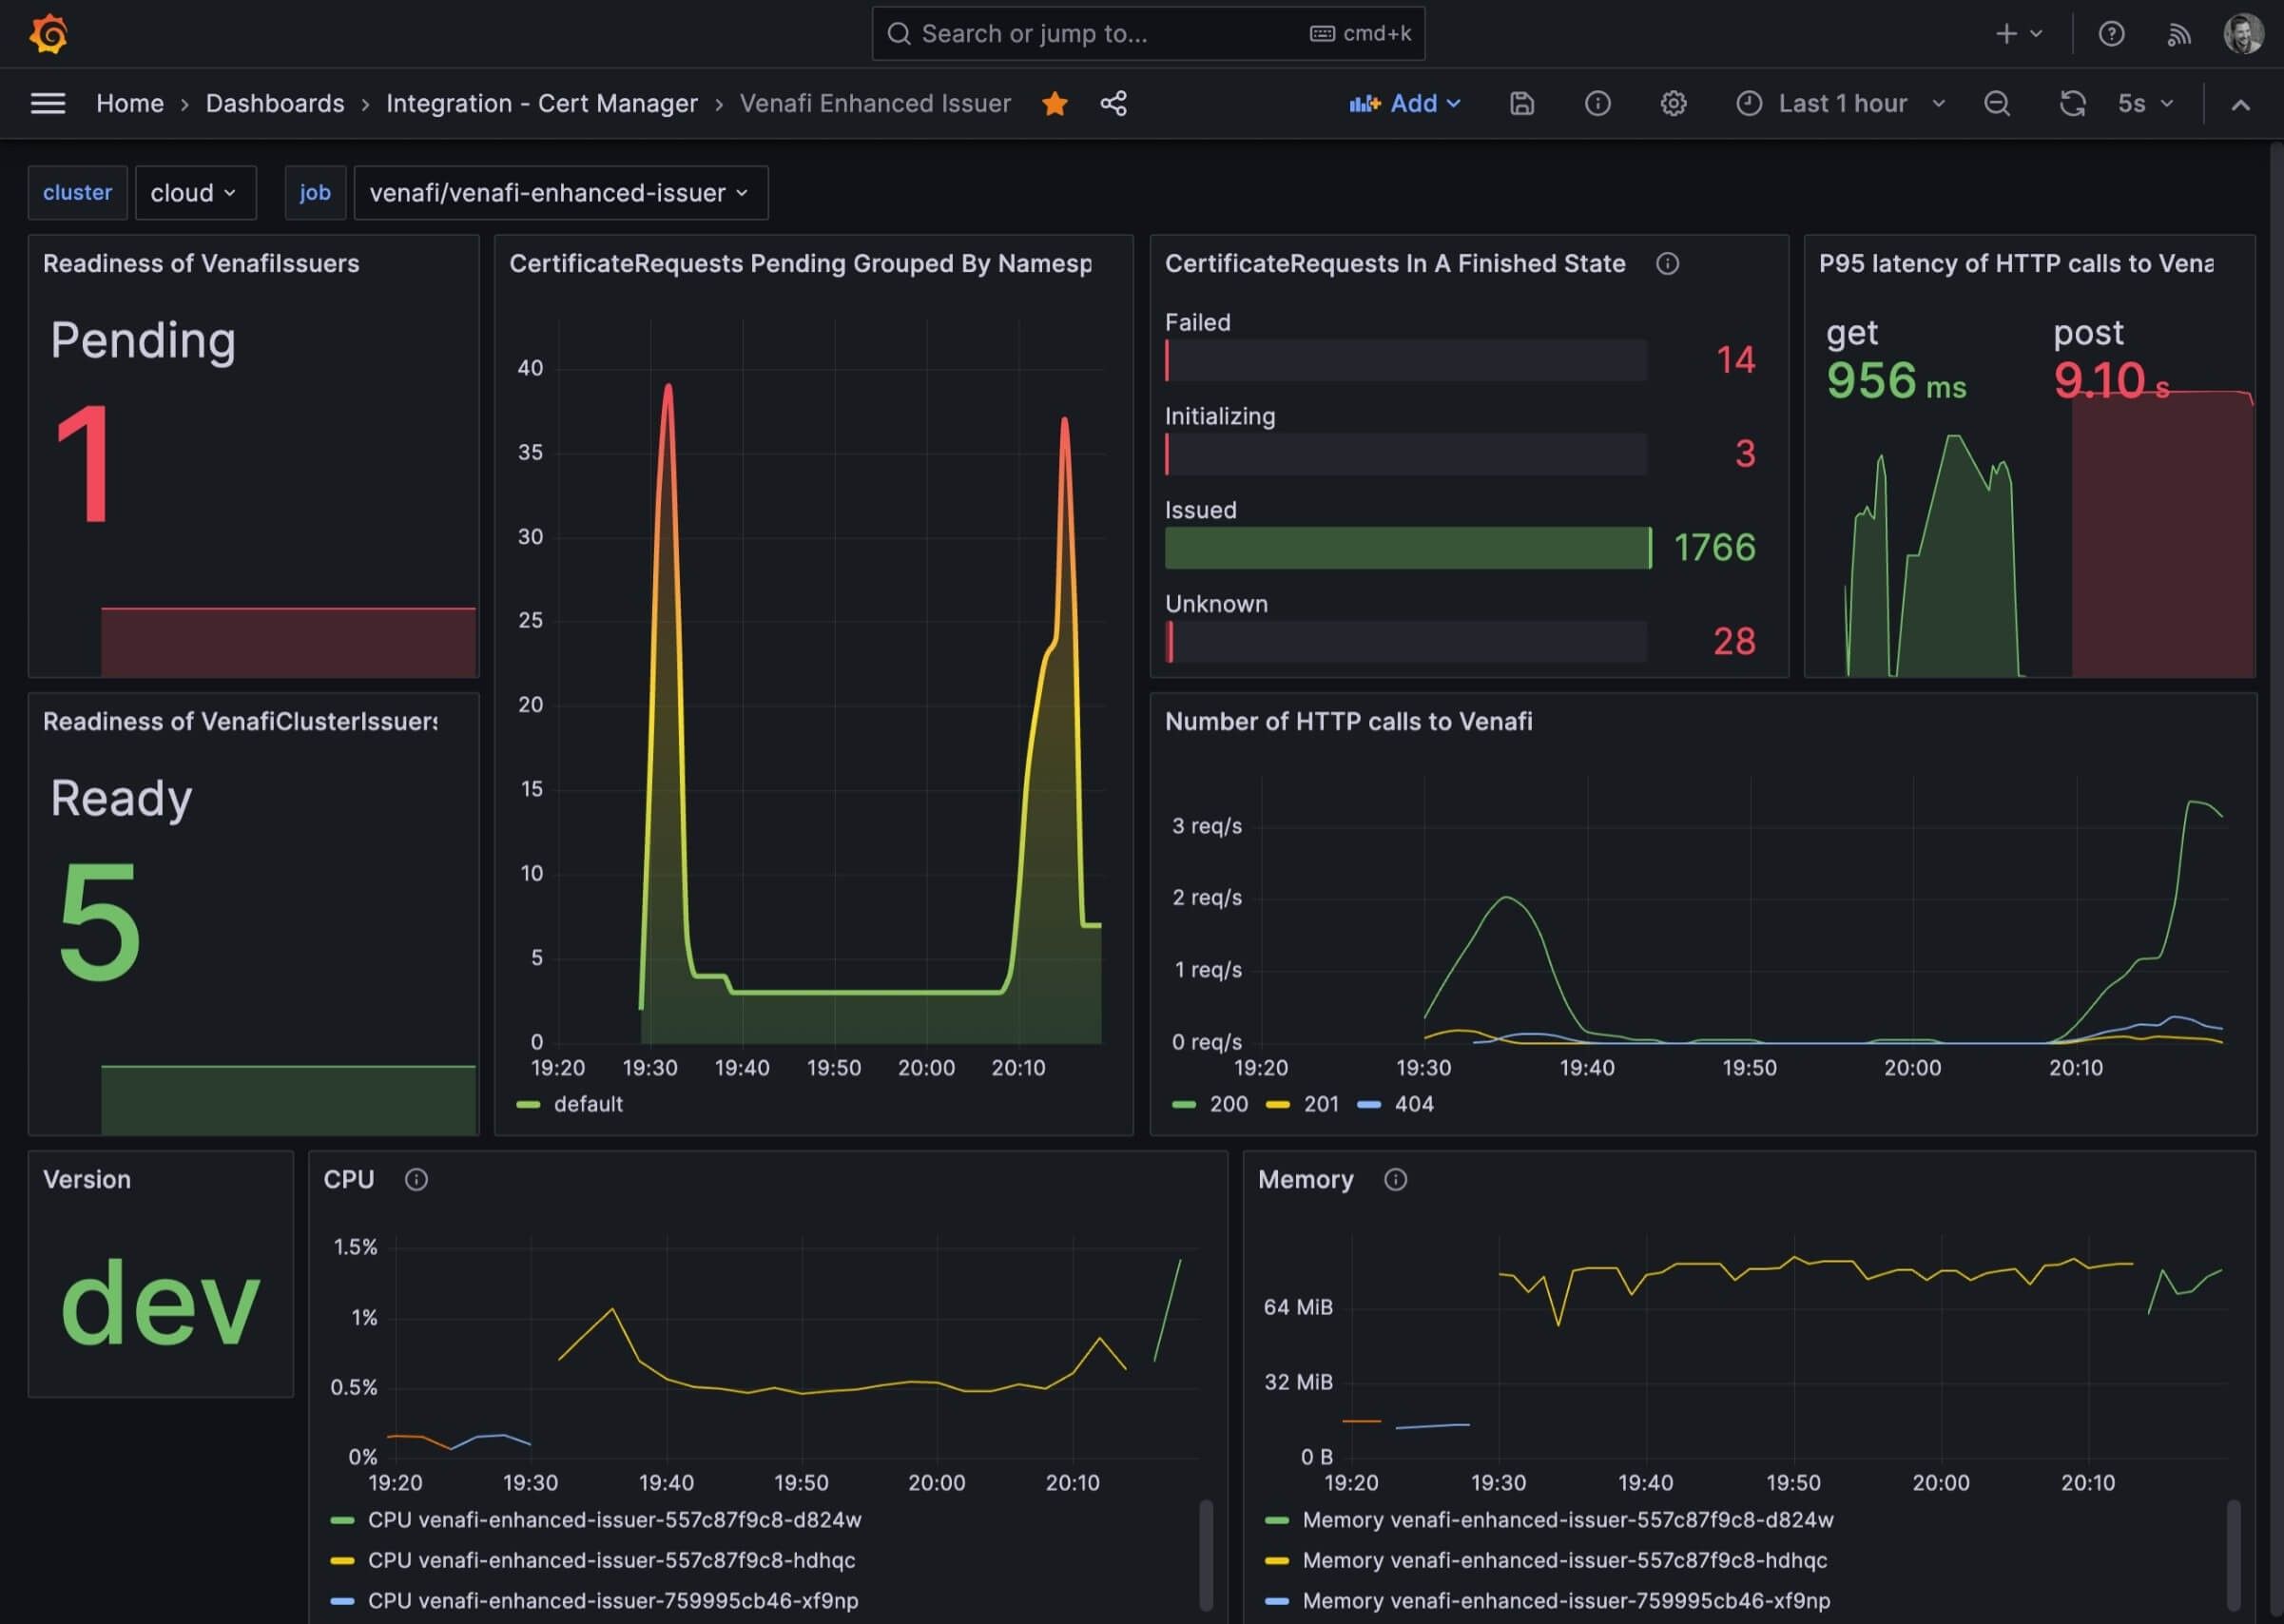
- Istio CSR
The graphic below shows an example of a Grafana dashboard for Enterprise Issuer for CyberArk Certificate Manager: