Metrics for Enterprise Approver Policy
Overview
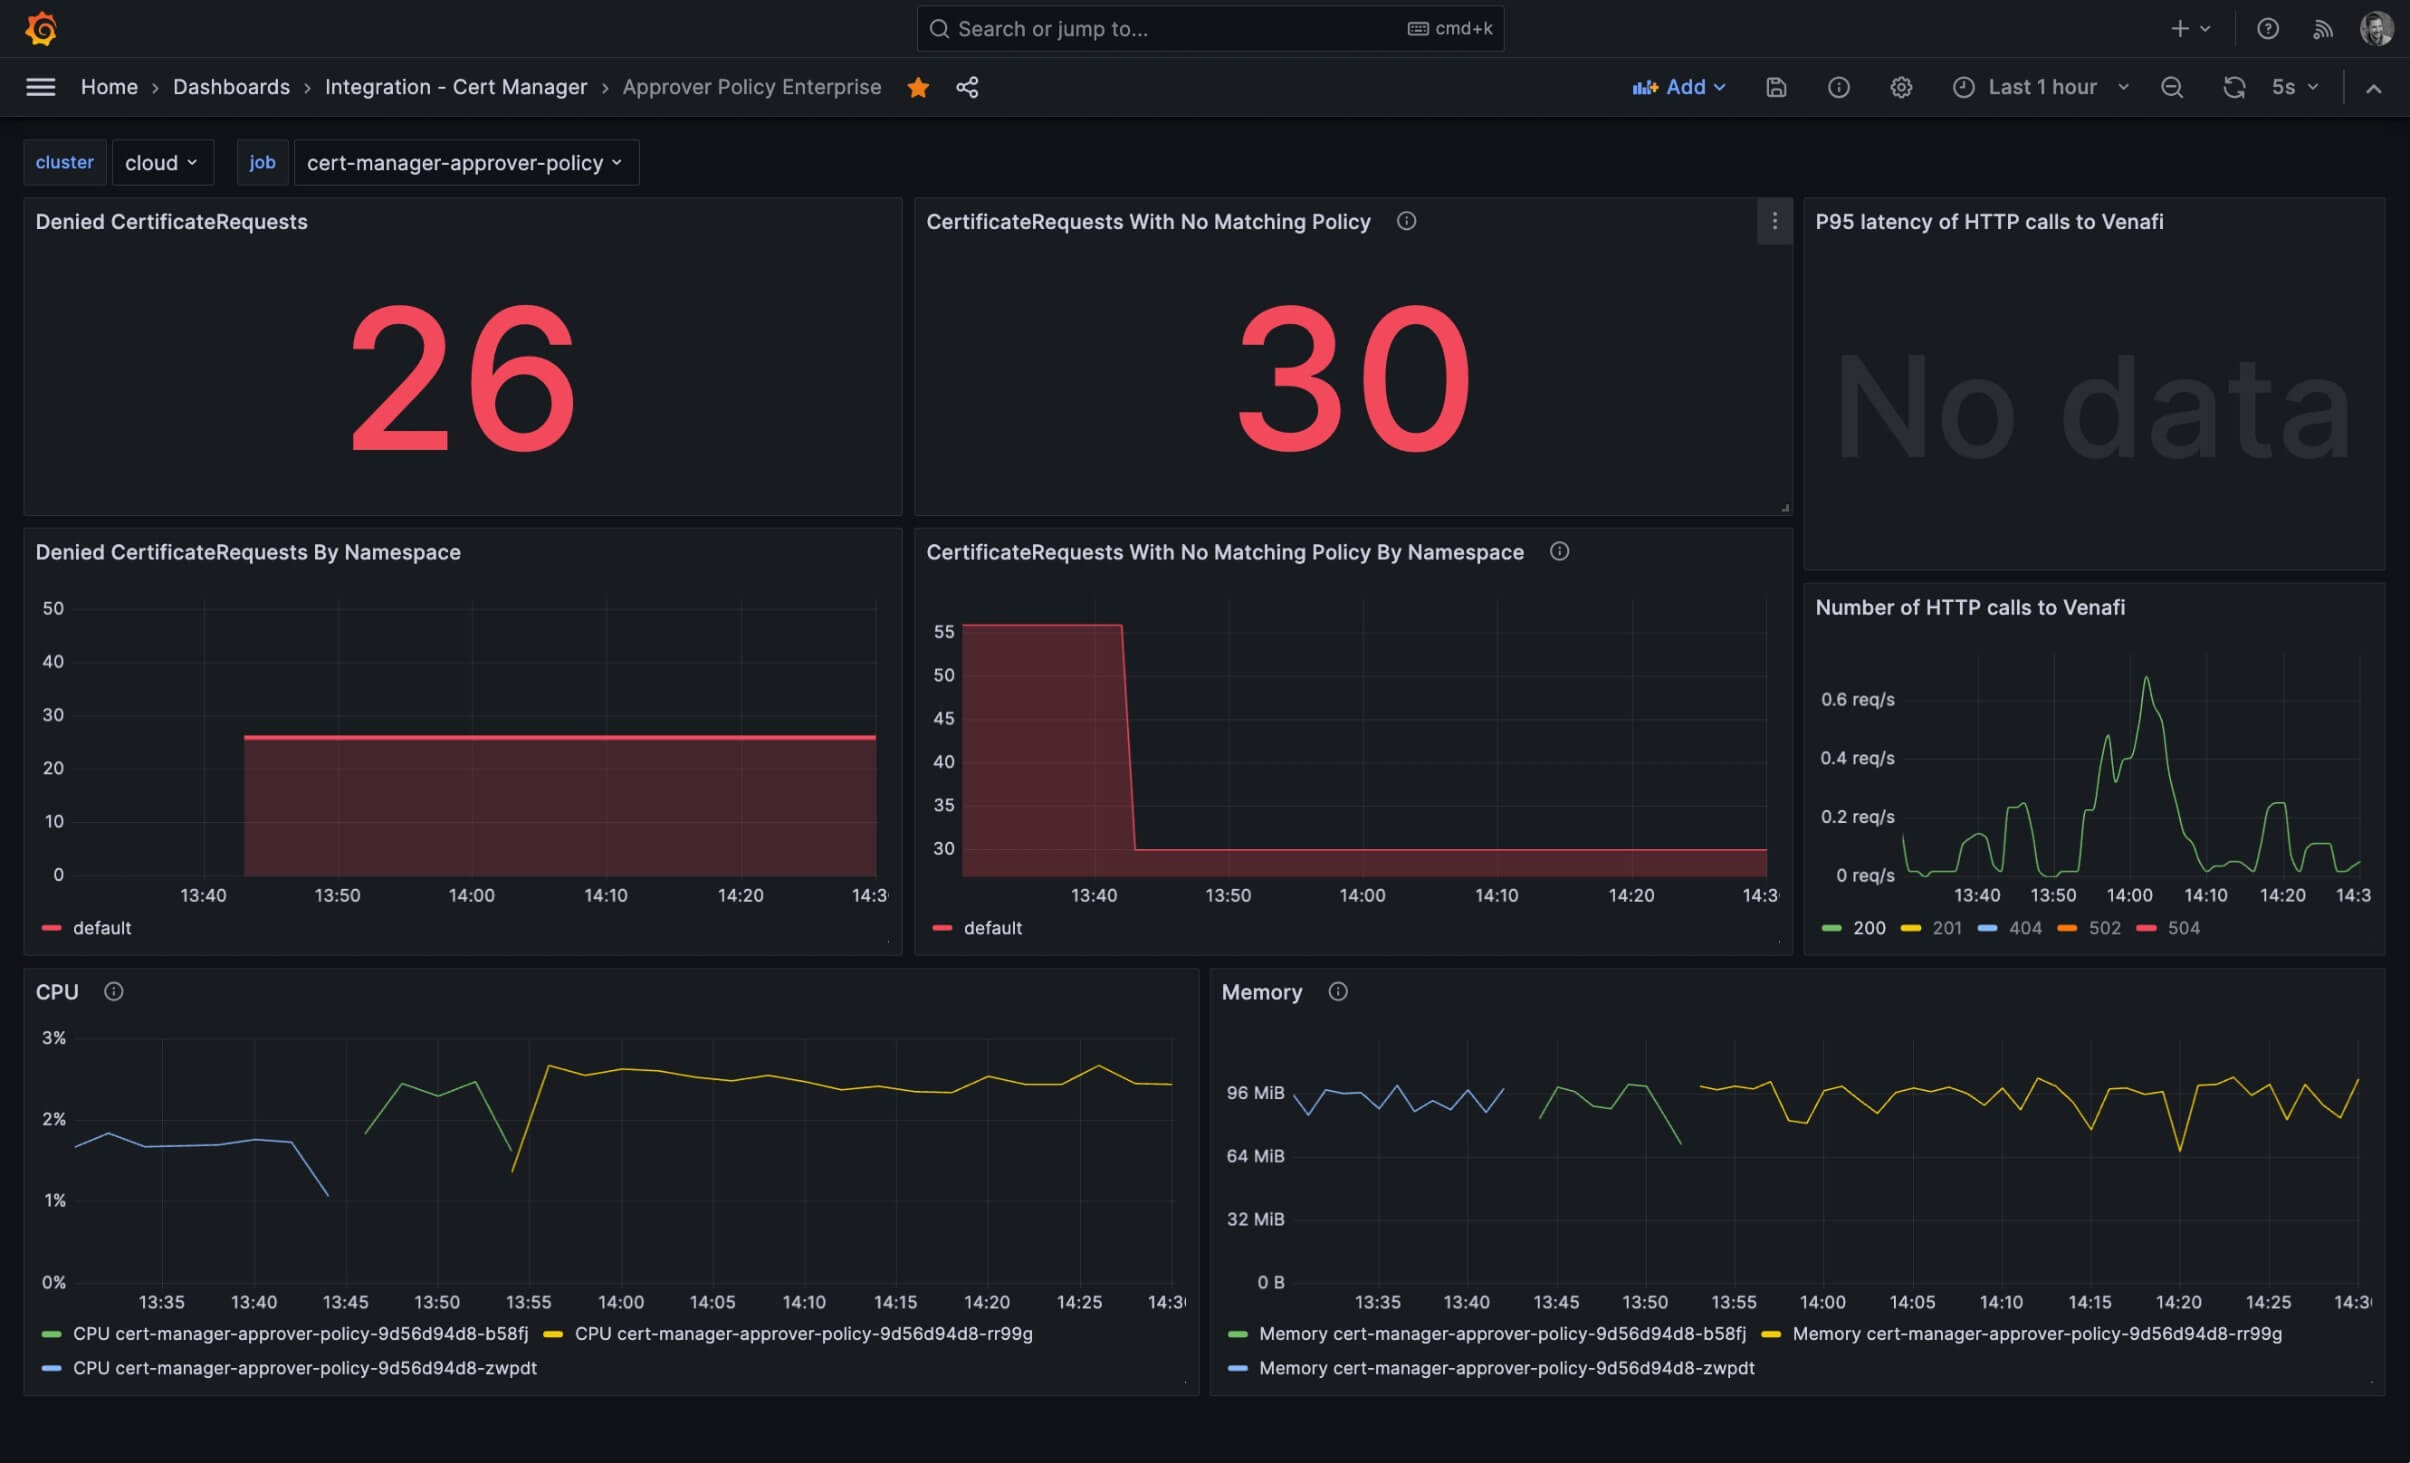
The Enterprise Approver Policy for CyberArk Certificate Manager (Enterprise Approver Policy) component (formerly known as Approver Policy Enterprise) exposes operational and usage telemetry metrics suitable for popular monitoring solutions, enabling alerts on important operational states. The graphic below shows an example of a Grafana dashboard for Enterprise Approver Policy.
All metrics formatted in Prometheus format are available at the standard /metrics path. They can accessed using the configured HTTP port of the controller component.
Enabling metrics
You need Enterprise Approver Policy for CyberArk Certificate Manager version 0.12.0 or later to use Prometheus metrics. The metrics aren't enabled by default. The example configuration below enables the metrics, and specifies the interval at which metrics should be scraped.
To enable the metrics, follow the deployment instructions at deploy Enterprise Approver Policy and add the following to the Helm values file:
cert-manager-approver-policy:
  app:
    metrics:
      service:
        enabled: true
        servicemonitor:
          enabled: true
There are various metrics configuration options in the Helm chart.
Certificate request count metrics
These two metrics provide information on "orphan" certificate requests (certificate requests that haven't been matched to any certificate request policies), and when there is an increase in the number of denials (indicating a possible mis-configuration).
-
approverpolicy_certificaterequest_orphan_count: An enum gauge metric for "orphan" certificate requests.Labels
namespace: The namespace of the certificate request resource.
-
approverpolicy_certificaterequest_approved_count: An gauge metric for approved/denied certificate requests.Labels
namespace: The namespace of the certificate request resource.approved_status: The approval status of the certificate request. Possible values areTrue,False.
Health of the Connection for CyberArk Certificate Manager metrics
The Connection resource venaficonnection_status indicates if connection to the Venafi API is successful or not with respect to which service is using the connection.
Labels
name: The name of the Connection resource.namespace: The name of the service that is using the connection.cond_type: This string represents the name of the component for whichcond_statusapplies. The possible values areVenafiEnhancedIssuerReadyandApproverPolicyVenafiReady.cond_status: The possible values areTrue(the connection to the Venafi service is OK) orFalse(the connection or authentication is failing).
For example, the following line means that the Connection resource conn is being used by the Enterprise Approver Policy component, and that the connection between Enterprise Approver Policy and Venafi is failing:
venaficonnection_status{name="conn",namespace="venafi",ready_status="False",cond_type="ApproverPolicyVenafiReady"} 1
Alerts
Connection resources with the condition type VenafiEnhancedIssuerReady or ApproverPolicyEnterpriseReady equal to False must be investigated. This will alert you when a component is unable to connect to the Venafi API.
If you have jq installed, you can identify the component that is using the connection. Use the following command to list the Connection resources:
kubectl get venaficonnection --all-namespaces -o json \
  | jq -r '.items[] | select(.status.conditions[].status == "True") | "\(.metadata.namespace) \(.metadata.name)"'
Once you have identified the Connection resource resource that contain a False condition, you can debug the problem by displaying its events:
kubectl describe venaficonnection -n <namespace> <name>
Latency and status codes of the HTTP requests metrics
These two metrics represent the latency and status codes of the HTTP requests to Certificate Manager - SaaS and Certificate Manager - Self-Hosted.
-
vcert_http_request_duration_seconds_bucket: A histogram metric indicating the durations of requests to Certificate Manager - SaaS and Certificate Manager - Self-Hosted.Labels
method: The HTTP method (for example, POST) of the request.path: The HTTP path of the request (for example,/outagedetection/v1/certificaterequests).host: The HTTP Host header of the request (for example,api.venafi.cloud).le: The time between the invocation of the HTTP request and the corresponding response.
-
vcert_http_requests_total: A counter metric indicating the total number of HTTP requests to Certificate Manager - SaaS and Certificate Manager - Self-Hosted.Labels
method: The HTTP method for example, POST) of the request.path: The HTTP path of the request (for example,/outagedetection/v1/certificaterequests).host: The HTTP Host header of the request (for example,api.venafi.cloud).code: The HTTP status code (for example, 200).
Alerts
If you notice a significant increase in failed HTTP requests (vcert_http_requests_total with code equal to or higher than 400), it's crucial to investigate the root cause of this issue.
The metric vcert_http_request_duration_seconds_bucket, when averaged, measures how fast Certificate Manager - SaaS and Certificate Manager - Self-Hosted respond to requests from Enterprise Issuer for CyberArk Certificate Manager. If you notice a significant increase in this metric, this requires investigation.
CPU and memory metrics
The CPU and memory metrics are provided by Kubernetes. The kubelet processes running on each Kubernetes node expose the endpoint /metrics/resources which, when scraped, provide the two following metrics (among others):
container_memory_usage_bytescontainer_cpu_usage_seconds_total
Tip
If you are using Prometheus and have installed it through the kube-prometheus operator, the metrics are already available to you. To install the kube-prometheus operator, see the Getting Started tutorial.
Visualizing metrics
CyberArk offers a sample Grafana dashboard in JSON format for you to import into your Grafana instance.
approver-policy-enterprise.grafana.json
{
"__inputs": [
{
"name": "DS_GRAFANACLOUD-EXAMPLE-PROM",
"label": "grafanacloud-example-prom",
"description": "",
"type": "datasource",
"pluginId": "prometheus",
"pluginName": "Prometheus"
}
],
"__elements": {},
"__requires": [
{
"type": "grafana",
"id": "grafana",
"name": "Grafana",
"version": "10.3.0-63839"
},
{
"type": "datasource",
"id": "prometheus",
"name": "Prometheus",
"version": "1.0.0"
},
{
"type": "panel",
"id": "stat",
"name": "Stat",
"version": ""
},
{
"type": "panel",
"id": "timeseries",
"name": "Time series",
"version": ""
}
],
"annotations": {
"list": [
{
"builtIn": 1,
"datasource": {
"type": "datasource",
"uid": "grafana"
},
"enable": true,
"hide": true,
"iconColor": "rgba(0, 211, 255, 1)",
"name": "Annotations & Alerts",
"target": {
"limit": 100,
"matchAny": false,
"tags": [],
"type": "dashboard"
},
"type": "dashboard"
}
]
},
"description": "",
"editable": true,
"fiscalYearStartMonth": 0,
"gnetId": 15920,
"graphTooltip": 0,
"id": null,
"links": [],
"liveNow": false,
"panels": [
{
"datasource": {
"type": "prometheus",
"uid": "${DS_GRAFANACLOUD-EXAMPLE-PROM}"
},
"description": "",
"fieldConfig": {
"defaults": {
"color": {
"fixedColor": "green",
"mode": "thresholds",
"seriesBy": "min"
},
"mappings": [],
"noValue": "All the certificate requests have been approved, all good!",
"thresholds": {
"mode": "absolute",
"steps": [
{
"color": "green",
"value": null
},
{
"color": "red",
"value": 1
}
]
}
},
"overrides": []
},
"gridPos": {
"h": 6,
"w": 9,
"x": 0,
"y": 0
},
"id": 25,
"options": {
"colorMode": "value",
"graphMode": "none",
"justifyMode": "auto",
"orientation": "auto",
"reduceOptions": {
"calcs": [
"lastNotNull"
],
"fields": "",
"values": false
},
"textMode": "auto",
"wideLayout": true
},
"pluginVersion": "10.3.0-63839",
"targets": [
{
"datasource": {
"type": "prometheus",
"uid": "${DS_GRAFANACLOUD-EXAMPLE-PROM}"
},
"disableTextWrap": false,
"editorMode": "code",
"exemplar": false,
"expr": "sum by(exported_namespace) (approverpolicy_certificaterequest_denied_count{cluster=\"$cluster\"})",
"format": "time_series",
"fullMetaSearch": false,
"hide": false,
"includeNullMetadata": true,
"instant": false,
"interval": "",
"legendFormat": "__auto",
"range": true,
"refId": "A",
"useBackend": false
}
],
"title": "Denied CertificateRequests",
"transformations": [],
"type": "stat"
},
{
"datasource": {
"type": "prometheus",
"uid": "${DS_GRAFANACLOUD-EXAMPLE-PROM}"
},
"description": "Count of CertificateRequests that can't be matched to any CertificateRequestPolicy. A CertificateRequest is said to be orphan when the Approved and Denied conditions are not set.",
"fieldConfig": {
"defaults": {
"color": {
"mode": "thresholds"
},
"mappings": [],
"noValue": "All the certificate requests have been matched, all good!",
"thresholds": {
"mode": "absolute",
"steps": [
{
"color": "text",
"value": null
},
{
"color": "red",
"value": 1
}
]
},
"unit": "short"
},
"overrides": []
},
"gridPos": {
"h": 6,
"w": 9,
"x": 9,
"y": 0
},
"id": 14,
"options": {
"colorMode": "value",
"graphMode": "none",
"justifyMode": "auto",
"orientation": "auto",
"reduceOptions": {
"calcs": [
"lastNotNull"
],
"fields": "",
"values": false
},
"textMode": "auto",
"wideLayout": true
},
"pluginVersion": "10.3.0-63839",
"targets": [
{
"datasource": {
"type": "prometheus",
"uid": "${DS_GRAFANACLOUD-EXAMPLE-PROM}"
},
"disableTextWrap": false,
"editorMode": "builder",
"expr": "sum(approverpolicy_certificaterequest_unmatched_count{cluster=\"$cluster\"})",
"fullMetaSearch": false,
"includeNullMetadata": true,
"instant": false,
"legendFormat": "__auto",
"range": true,
"refId": "A",
"useBackend": false
}
],
"title": "CertificateRequests With No Matching Policy",
"type": "stat"
},
{
"datasource": {
"type": "prometheus",
"uid": "${DS_GRAFANACLOUD-EXAMPLE-PROM}"
},
"description": "",
"fieldConfig": {
"defaults": {
"color": {
"mode": "thresholds"
},
"mappings": [],
"noValue": "0",
"thresholds": {
"mode": "absolute",
"steps": [
{
"color": "green",
"value": null
},
{
"color": "red",
"value": 1
}
]
},
"unit": "short"
},
"overrides": []
},
"gridPos": {
"h": 6,
"w": 6,
"x": 18,
"y": 0
},
"id": 27,
"options": {
"colorMode": "value",
"graphMode": "none",
"justifyMode": "auto",
"orientation": "auto",
"reduceOptions": {
"calcs": [
"lastNotNull"
],
"fields": "",
"values": false
},
"textMode": "auto",
"wideLayout": true
},
"pluginVersion": "10.3.0-63839",
"targets": [
{
"datasource": {
"type": "prometheus",
"uid": "${DS_GRAFANACLOUD-EXAMPLE-PROM}"
},
"disableTextWrap": false,
"editorMode": "builder",
"expr": "sum(venaficonnection_status{cluster=\"$cluster\", cond_type=\"ApproverPolicyVenafiReady\", cond_status!=\"True\"})",
"fullMetaSearch": false,
"includeNullMetadata": true,
"instant": false,
"legendFormat": "__auto",
"range": true,
"refId": "A",
"useBackend": false
}
],
"title": "Failing VenafiConnections",
"type": "stat"
},
{
"datasource": {
"type": "prometheus",
"uid": "${DS_GRAFANACLOUD-EXAMPLE-PROM}"
},
"description": "",
"fieldConfig": {
"defaults": {
"color": {
"fixedColor": "red",
"mode": "fixed",
"seriesBy": "min"
},
"custom": {
"axisBorderShow": false,
"axisCenteredZero": false,
"axisColorMode": "text",
"axisLabel": "",
"axisPlacement": "auto",
"barAlignment": 0,
"drawStyle": "line",
"fillOpacity": 20,
"gradientMode": "scheme",
"hideFrom": {
"legend": false,
"tooltip": false,
"viz": false
},
"insertNulls": false,
"lineInterpolation": "smooth",
"lineWidth": 3,
"pointSize": 5,
"scaleDistribution": {
"type": "linear"
},
"showPoints": "auto",
"spanNulls": false,
"stacking": {
"group": "A",
"mode": "normal"
},
"thresholdsStyle": {
"mode": "off"
}
},
"mappings": [],
"noValue": "All the certificate requests have been approved, all good!",
"thresholds": {
"mode": "absolute",
"steps": [
{
"color": "green",
"value": null
},
{
"color": "red",
"value": 80
}
]
}
},
"overrides": []
},
"gridPos": {
"h": 8,
"w": 9,
"x": 0,
"y": 6
},
"id": 20,
"options": {
"legend": {
"calcs": [],
"displayMode": "list",
"placement": "bottom",
"showLegend": true
},
"tooltip": {
"mode": "single",
"sort": "none"
}
},
"pluginVersion": "10.3.0-62736",
"targets": [
{
"datasource": {
"type": "prometheus",
"uid": "${DS_GRAFANACLOUD-EXAMPLE-PROM}"
},
"disableTextWrap": false,
"editorMode": "code",
"exemplar": false,
"expr": "sum by(exported_namespace) (approverpolicy_certificaterequest_denied_count{cluster=\"$cluster\"})",
"format": "time_series",
"fullMetaSearch": false,
"hide": false,
"includeNullMetadata": true,
"instant": false,
"interval": "",
"legendFormat": "__auto",
"range": true,
"refId": "A",
"useBackend": false
}
],
"title": "Denied CertificateRequests By Namespace",
"transformations": [],
"type": "timeseries"
},
{
"datasource": {
"type": "prometheus",
"uid": "${DS_GRAFANACLOUD-EXAMPLE-PROM}"
},
"description": "Count of CertificateRequests that can't be matched to any CertificateRequestPolicy. A CertificateRequest is said to be orphan when the Approved and Denied conditions are not set.",
"fieldConfig": {
"defaults": {
"color": {
"mode": "thresholds"
},
"custom": {
"axisBorderShow": false,
"axisCenteredZero": false,
"axisColorMode": "text",
"axisLabel": "",
"axisPlacement": "auto",
"barAlignment": 0,
"drawStyle": "line",
"fillOpacity": 25,
"gradientMode": "none",
"hideFrom": {
"legend": false,
"tooltip": false,
"viz": false
},
"insertNulls": false,
"lineInterpolation": "linear",
"lineWidth": 1,
"pointSize": 5,
"scaleDistribution": {
"type": "linear"
},
"showPoints": "auto",
"spanNulls": false,
"stacking": {
"group": "A",
"mode": "normal"
},
"thresholdsStyle": {
"mode": "off"
}
},
"mappings": [],
"noValue": "All the certificate requests have been matched, all good!",
"thresholds": {
"mode": "absolute",
"steps": [
{
"color": "green",
"value": null
},
{
"color": "red",
"value": 1
}
]
}
},
"overrides": []
},
"gridPos": {
"h": 8,
"w": 9,
"x": 9,
"y": 6
},
"id": 26,
"options": {
"legend": {
"calcs": [],
"displayMode": "list",
"placement": "bottom",
"showLegend": true
},
"tooltip": {
"mode": "single",
"sort": "none"
}
},
"pluginVersion": "10.3.0-62736",
"targets": [
{
"datasource": {
"type": "prometheus",
"uid": "${DS_GRAFANACLOUD-EXAMPLE-PROM}"
},
"disableTextWrap": false,
"editorMode": "builder",
"expr": "sum by(exported_namespace) (approverpolicy_certificaterequest_unmatched_count{cluster=\"$cluster\"})",
"fullMetaSearch": false,
"includeNullMetadata": true,
"instant": false,
"legendFormat": "__auto",
"range": true,
"refId": "A",
"useBackend": false
}
],
"title": "CertificateRequests With No Matching Policy By Namespace",
"type": "timeseries"
},
{
"datasource": {
"type": "prometheus",
"uid": "${DS_GRAFANACLOUD-EXAMPLE-PROM}"
},
"fieldConfig": {
"defaults": {
"color": {
"mode": "thresholds"
},
"mappings": [],
"thresholds": {
"mode": "absolute",
"steps": [
{
"color": "#ccccdb1a",
"value": null
},
{
"color": "green",
"value": 0.1
},
{
"color": "yellow",
"value": 1
},
{
"color": "red",
"value": 5
}
]
},
"unit": "s"
},
"overrides": []
},
"gridPos": {
"h": 8,
"w": 6,
"x": 18,
"y": 6
},
"id": 15,
"options": {
"colorMode": "value",
"graphMode": "area",
"justifyMode": "auto",
"orientation": "auto",
"reduceOptions": {
"calcs": [
"lastNotNull"
],
"fields": "",
"values": false
},
"textMode": "value_and_name",
"wideLayout": true
},
"pluginVersion": "10.3.0-63839",
"targets": [
{
"datasource": {
"type": "prometheus",
"uid": "${DS_GRAFANACLOUD-EXAMPLE-PROM}"
},
"disableTextWrap": false,
"editorMode": "code",
"expr": "histogram_quantile(0.95, sum by(le, method) (rate(vcert_http_request_duration_seconds_bucket{cluster=\"$cluster\",job=\"$job\"}[$__rate_interval])))",
"fullMetaSearch": false,
"includeNullMetadata": true,
"instant": false,
"legendFormat": "__auto",
"range": true,
"refId": "A",
"useBackend": false
}
],
"title": "P95 latency of HTTP calls to Venafi",
"type": "stat"
},
{
"datasource": {
"type": "prometheus",
"uid": "${DS_GRAFANACLOUD-EXAMPLE-PROM}"
},
"description": "CPU Usage and limits, as percent of a vCPU core. ",
"fieldConfig": {
"defaults": {
"color": {
"mode": "palette-classic"
},
"custom": {
"axisBorderShow": false,
"axisCenteredZero": false,
"axisColorMode": "text",
"axisLabel": "",
"axisPlacement": "auto",
"barAlignment": 0,
"drawStyle": "line",
"fillOpacity": 0,
"gradientMode": "none",
"hideFrom": {
"legend": false,
"tooltip": false,
"viz": false
},
"insertNulls": false,
"lineInterpolation": "linear",
"lineWidth": 1,
"pointSize": 5,
"scaleDistribution": {
"type": "linear"
},
"showPoints": "never",
"spanNulls": false,
"stacking": {
"group": "A",
"mode": "none"
},
"thresholdsStyle": {
"mode": "off"
}
},
"links": [],
"mappings": [],
"min": 0,
"thresholds": {
"mode": "absolute",
"steps": [
{
"color": "green",
"value": null
},
{
"color": "red",
"value": 80
}
]
},
"unit": "percentunit"
},
"overrides": [
{
"matcher": {
"id": "byName",
"options": "max"
},
"properties": [
{
"id": "color",
"value": {
"fixedColor": "dark-yellow",
"mode": "fixed"
}
}
]
},
{
"matcher": {
"id": "byName",
"options": "CPU"
},
"properties": [
{
"id": "custom.fillOpacity",
"value": 10
},
{
"id": "custom.fillOpacity",
"value": 50
}
]
},
{
"matcher": {
"id": "byRegexp",
"options": "/Request.*/"
},
"properties": [
{
"id": "color",
"value": {
"fixedColor": "#FF9830",
"mode": "fixed"
}
},
{
"id": "custom.lineStyle",
"value": {
"dash": [
10,
10
],
"fill": "dash"
}
}
]
},
{
"matcher": {
"id": "byRegexp",
"options": "/Limit.*/"
},
"properties": [
{
"id": "color",
"value": {
"fixedColor": "#F2495C",
"mode": "fixed"
}
},
{
"id": "custom.lineStyle",
"value": {
"dash": [
10,
10
],
"fill": "dash"
}
}
]
}
]
},
"gridPos": {
"h": 8,
"w": 8,
"x": 0,
"y": 14
},
"id": 24,
"interval": "1m",
"links": [],
"maxDataPoints": 250,
"options": {
"legend": {
"calcs": [],
"displayMode": "list",
"placement": "bottom",
"showLegend": true
},
"tooltip": {
"mode": "multi",
"sort": "none"
}
},
"pluginVersion": "10.3.0-62411",
"targets": [
{
"datasource": {
"uid": "$datasource"
},
"editorMode": "code",
"expr": "avg by (pod) (rate(container_cpu_usage_seconds_total{container=\"cert-manager-approver-policy\", cluster=\"$cluster\"}[$__rate_interval]))",
"format": "time_series",
"hide": false,
"interval": "",
"intervalFactor": 2,
"legendFormat": "CPU {{ pod }}",
"range": true,
"refId": "A"
},
{
"datasource": {
"uid": "$datasource"
},
"editorMode": "code",
"expr": "avg by (pod) (kube_pod_container_resource_limits_cpu_cores{container=\"cert-manager-approver-policy\", cluster=\"$cluster\"})",
"format": "time_series",
"hide": true,
"interval": "",
"intervalFactor": 1,
"legendFormat": "Limit {{ pod }}",
"range": true,
"refId": "B"
},
{
"datasource": {
"uid": "$datasource"
},
"editorMode": "code",
"expr": "avg by (pod) (kube_pod_container_resource_requests_cpu_cores{container=\"cert-manager-approver-policy\", cluster=\"$cluster\"})",
"format": "time_series",
"hide": true,
"interval": "",
"intervalFactor": 1,
"legendFormat": "Request {{ pod }}",
"range": true,
"refId": "C"
}
],
"title": "CPU",
"type": "timeseries"
},
{
"datasource": {
"type": "prometheus",
"uid": "${DS_GRAFANACLOUD-EXAMPLE-PROM}"
},
"description": "Memory utilisation and limits.",
"fieldConfig": {
"defaults": {
"color": {
"mode": "palette-classic"
},
"custom": {
"axisBorderShow": false,
"axisCenteredZero": false,
"axisColorMode": "text",
"axisLabel": "",
"axisPlacement": "auto",
"barAlignment": 0,
"drawStyle": "line",
"fillOpacity": 0,
"gradientMode": "none",
"hideFrom": {
"legend": false,
"tooltip": false,
"viz": false
},
"insertNulls": false,
"lineInterpolation": "linear",
"lineWidth": 1,
"pointSize": 5,
"scaleDistribution": {
"type": "linear"
},
"showPoints": "never",
"spanNulls": false,
"stacking": {
"group": "A",
"mode": "none"
},
"thresholdsStyle": {
"mode": "off"
}
},
"links": [],
"mappings": [],
"min": 0,
"thresholds": {
"mode": "absolute",
"steps": [
{
"color": "green",
"value": null
},
{
"color": "red",
"value": 80
}
]
},
"unit": "bytes"
},
"overrides": [
{
"matcher": {
"id": "byName",
"options": "max"
},
"properties": [
{
"id": "color",
"value": {
"fixedColor": "dark-yellow",
"mode": "fixed"
}
}
]
},
{
"matcher": {
"id": "byName",
"options": "Memory"
},
"properties": [
{
"id": "custom.fillOpacity",
"value": 10
},
{
"id": "custom.fillOpacity",
"value": 50
}
]
},
{
"matcher": {
"id": "byName",
"options": "Request"
},
"properties": [
{
"id": "color",
"value": {
"fixedColor": "#FF9830",
"mode": "fixed"
}
},
{
"id": "custom.lineStyle",
"value": {
"dash": [
10,
10
],
"fill": "dash"
}
}
]
},
{
"matcher": {
"id": "byName",
"options": "Limit"
},
"properties": [
{
"id": "color",
"value": {
"fixedColor": "#F2495C",
"mode": "fixed"
}
},
{
"id": "custom.lineStyle",
"value": {
"dash": [
10,
10
],
"fill": "dash"
}
}
]
}
]
},
"gridPos": {
"h": 8,
"w": 8,
"x": 8,
"y": 14
},
"id": 23,
"interval": "1m",
"links": [],
"maxDataPoints": 250,
"options": {
"legend": {
"calcs": [],
"displayMode": "list",
"placement": "bottom",
"showLegend": true
},
"tooltip": {
"mode": "multi",
"sort": "none"
}
},
"pluginVersion": "10.3.0-62411",
"targets": [
{
"datasource": {
"uid": "$datasource"
},
"editorMode": "code",
"expr": "avg by (pod) (container_memory_usage_bytes{container=\"cert-manager-approver-policy\", cluster=\"$cluster\"})",
"format": "time_series",
"hide": false,
"interval": "",
"intervalFactor": 1,
"legendFormat": "Memory {{ pod }}",
"range": true,
"refId": "A"
},
{
"datasource": {
"uid": "$datasource"
},
"editorMode": "code",
"expr": "avg by (pod) (kube_pod_container_resource_limits_memory_bytes{container=\"cert-manager-approver-policy\", cluster=\"$cluster\"})",
"format": "time_series",
"interval": "",
"intervalFactor": 1,
"legendFormat": "Limit {{ pod }}",
"range": true,
"refId": "B"
},
{
"datasource": {
"uid": "$datasource"
},
"editorMode": "code",
"expr": "avg by (pod) (kube_pod_container_resource_requests_memory_bytes{container=\"cert-manager-approver-policy\", cluster=\"$cluster\"})",
"format": "time_series",
"interval": "",
"intervalFactor": 1,
"legendFormat": "Request {{ pod }}",
"range": true,
"refId": "C"
}
],
"title": "Memory",
"type": "timeseries"
},
{
"datasource": {
"type": "prometheus",
"uid": "${DS_GRAFANACLOUD-EXAMPLE-PROM}"
},
"description": "",
"fieldConfig": {
"defaults": {
"color": {
"mode": "palette-classic"
},
"custom": {
"axisBorderShow": false,
"axisCenteredZero": false,
"axisColorMode": "text",
"axisLabel": "",
"axisPlacement": "auto",
"barAlignment": 0,
"drawStyle": "line",
"fillOpacity": 0,
"gradientMode": "none",
"hideFrom": {
"legend": false,
"tooltip": false,
"viz": false
},
"insertNulls": false,
"lineInterpolation": "smooth",
"lineWidth": 1,
"pointSize": 5,
"scaleDistribution": {
"type": "linear"
},
"showPoints": "auto",
"spanNulls": false,
"stacking": {
"group": "A",
"mode": "none"
},
"thresholdsStyle": {
"mode": "off"
}
},
"mappings": [],
"thresholds": {
"mode": "absolute",
"steps": [
{
"color": "green",
"value": null
},
{
"color": "red",
"value": 80
}
]
},
"unit": "reqps"
},
"overrides": [
{
"__systemRef": "hideSeriesFrom",
"matcher": {
"id": "byNames",
"options": {
"mode": "exclude",
"names": [
"200"
],
"prefix": "All except:",
"readOnly": true
}
},
"properties": [
{
"id": "custom.hideFrom",
"value": {
"legend": false,
"tooltip": false,
"viz": true
}
}
]
}
]
},
"gridPos": {
"h": 8,
"w": 8,
"x": 16,
"y": 14
},
"id": 16,
"options": {
"legend": {
"calcs": [],
"displayMode": "list",
"placement": "bottom",
"showLegend": true
},
"tooltip": {
"mode": "single",
"sort": "asc"
}
},
"pluginVersion": "10.2.0-61298",
"targets": [
{
"datasource": {
"type": "prometheus",
"uid": "${DS_GRAFANACLOUD-EXAMPLE-PROM}"
},
"disableTextWrap": false,
"editorMode": "code",
"expr": "sum by (code) (\n rate(vcert_http_requests_total{cluster=\"$cluster\"}[$__rate_interval])\n)",
"fullMetaSearch": false,
"includeNullMetadata": true,
"instant": false,
"legendFormat": "__auto",
"range": true,
"refId": "A",
"useBackend": false
}
],
"title": "Number of HTTP calls to Venafi",
"type": "timeseries"
}
],
"refresh": "5s",
"schemaVersion": 39,
"tags": [],
"templating": {
"list": [
{
"current": {},
"datasource": {
"type": "prometheus",
"uid": "${DS_GRAFANACLOUD-EXAMPLE-PROM}"
},
"definition": "label_values(venafienhancedissuer_info,cluster)",
"hide": 0,
"includeAll": false,
"multi": false,
"name": "cluster",
"options": [],
"query": {
"qryType": 1,
"query": "label_values(venafienhancedissuer_info,cluster)",
"refId": "PrometheusVariableQueryEditor-VariableQuery"
},
"refresh": 1,
"regex": "",
"skipUrlSync": false,
"sort": 0,
"type": "query"
},
{
"current": {},
"datasource": {
"type": "prometheus",
"uid": "${DS_GRAFANACLOUD-EXAMPLE-PROM}"
},
"definition": "label_values(approverpolicy_certificaterequest_approved_count,job)",
"hide": 0,
"includeAll": false,
"multi": false,
"name": "job",
"options": [],
"query": {
"qryType": 1,
"query": "label_values(approverpolicy_certificaterequest_approved_count,job)",
"refId": "PrometheusVariableQueryEditor-VariableQuery"
},
"refresh": 1,
"regex": "",
"skipUrlSync": false,
"sort": 0,
"type": "query"
},
{
"current": {
"selected": false,
"text": "default",
"value": "default"
},
"hide": 0,
"includeAll": false,
"multi": false,
"name": "datasource",
"options": [],
"query": "prometheus",
"refresh": 1,
"regex": "",
"skipUrlSync": false,
"type": "datasource"
}
]
},
"time": {
"from": "now-1h",
"to": "now"
},
"timepicker": {
"refresh_intervals": [
"5s",
"10s",
"30s",
"1m",
"5m",
"15m",
"30m",
"1h",
"2h",
"1d"
]
},
"timezone": "",
"title": "Enterprise Approver Policy",
"uid": "a1831fd0-63a4-40ff-a463-fcd63b56103a",
"version": 12,
"weekStart": ""
}
Reference
You can query the metrics endpoint and fetch the current metrics data as follows:
POD_NAME=$(kubectl get pod -n venafi -l app=cert-manager-approver-policy -o jsonpath='{ .items[0].metadata.name }')
kubectl get --raw "/api/v1/namespaces/venafi/pods/${POD_NAME}:9402/proxy/metrics" | grep -A1 'HELP'
Full metrics reference
Here are the metrics that Enterprise Approver Policy exports:
# HELP approverpolicy_certificaterequest_approved_count Number of CertificateRequests that have been approved (Approved=True).
# TYPE approverpolicy_certificaterequest_approved_count gauge
--
# HELP certwatcher_read_certificate_errors_total Total number of certificate read errors
# TYPE certwatcher_read_certificate_errors_total counter
--
# HELP certwatcher_read_certificate_total Total number of certificate reads
# TYPE certwatcher_read_certificate_total counter
--
# HELP controller_runtime_active_workers Number of currently used workers per controller
# TYPE controller_runtime_active_workers gauge
--
# HELP controller_runtime_max_concurrent_reconciles Maximum number of concurrent reconciles per controller
# TYPE controller_runtime_max_concurrent_reconciles gauge
--
# HELP controller_runtime_reconcile_errors_total Total number of reconciliation errors per controller
# TYPE controller_runtime_reconcile_errors_total counter
--
# HELP controller_runtime_reconcile_time_seconds Length of time per reconciliation per controller
# TYPE controller_runtime_reconcile_time_seconds histogram
--
# HELP controller_runtime_reconcile_total Total number of reconciliations per controller
# TYPE controller_runtime_reconcile_total counter
--
# HELP controller_runtime_webhook_latency_seconds Histogram of the latency of processing admission requests
# TYPE controller_runtime_webhook_latency_seconds histogram
--
# HELP controller_runtime_webhook_requests_in_flight Current number of admission requests being served.
# TYPE controller_runtime_webhook_requests_in_flight gauge
--
# HELP controller_runtime_webhook_requests_total Total number of admission requests by HTTP status code.
# TYPE controller_runtime_webhook_requests_total counter
--
# HELP go_gc_duration_seconds A summary of the pause duration of garbage collection cycles.
# TYPE go_gc_duration_seconds summary
--
# HELP go_goroutines Number of goroutines that currently exist.
# TYPE go_goroutines gauge
--
# HELP go_info Information about the Go environment.
# TYPE go_info gauge
--
# HELP go_memstats_alloc_bytes Number of bytes allocated and still in use.
# TYPE go_memstats_alloc_bytes gauge
--
# HELP go_memstats_alloc_bytes_total Total number of bytes allocated, even if freed.
# TYPE go_memstats_alloc_bytes_total counter
--
# HELP go_memstats_buck_hash_sys_bytes Number of bytes used by the profiling bucket hash table.
# TYPE go_memstats_buck_hash_sys_bytes gauge
--
# HELP go_memstats_frees_total Total number of frees.
# TYPE go_memstats_frees_total counter
--
# HELP go_memstats_gc_sys_bytes Number of bytes used for garbage collection system metadata.
# TYPE go_memstats_gc_sys_bytes gauge
--
# HELP go_memstats_heap_alloc_bytes Number of heap bytes allocated and still in use.
# TYPE go_memstats_heap_alloc_bytes gauge
--
# HELP go_memstats_heap_idle_bytes Number of heap bytes waiting to be used.
# TYPE go_memstats_heap_idle_bytes gauge
--
# HELP go_memstats_heap_inuse_bytes Number of heap bytes that are in use.
# TYPE go_memstats_heap_inuse_bytes gauge
--
# HELP go_memstats_heap_objects Number of allocated objects.
# TYPE go_memstats_heap_objects gauge
--
# HELP go_memstats_heap_released_bytes Number of heap bytes released to OS.
# TYPE go_memstats_heap_released_bytes gauge
--
# HELP go_memstats_heap_sys_bytes Number of heap bytes obtained from system.
# TYPE go_memstats_heap_sys_bytes gauge
--
# HELP go_memstats_last_gc_time_seconds Number of seconds since 1970 of last garbage collection.
# TYPE go_memstats_last_gc_time_seconds gauge
--
# HELP go_memstats_lookups_total Total number of pointer lookups.
# TYPE go_memstats_lookups_total counter
--
# HELP go_memstats_mallocs_total Total number of mallocs.
# TYPE go_memstats_mallocs_total counter
--
# HELP go_memstats_mcache_inuse_bytes Number of bytes in use by mcache structures.
# TYPE go_memstats_mcache_inuse_bytes gauge
--
# HELP go_memstats_mcache_sys_bytes Number of bytes used for mcache structures obtained from system.
# TYPE go_memstats_mcache_sys_bytes gauge
--
# HELP go_memstats_mspan_inuse_bytes Number of bytes in use by mspan structures.
# TYPE go_memstats_mspan_inuse_bytes gauge
--
# HELP go_memstats_mspan_sys_bytes Number of bytes used for mspan structures obtained from system.
# TYPE go_memstats_mspan_sys_bytes gauge
--
# HELP go_memstats_next_gc_bytes Number of heap bytes when next garbage collection will take place.
# TYPE go_memstats_next_gc_bytes gauge
--
# HELP go_memstats_other_sys_bytes Number of bytes used for other system allocations.
# TYPE go_memstats_other_sys_bytes gauge
--
# HELP go_memstats_stack_inuse_bytes Number of bytes in use by the stack allocator.
# TYPE go_memstats_stack_inuse_bytes gauge
--
# HELP go_memstats_stack_sys_bytes Number of bytes obtained from system for stack allocator.
# TYPE go_memstats_stack_sys_bytes gauge
--
# HELP go_memstats_sys_bytes Number of bytes obtained from system.
# TYPE go_memstats_sys_bytes gauge
--
# HELP go_threads Number of OS threads created.
# TYPE go_threads gauge
--
# HELP leader_election_master_status Gauge of if the reporting system is master of the relevant lease, 0 indicates backup, 1 indicates master. 'name' is the string used to identify the lease. Please make sure to group by name.
# TYPE leader_election_master_status gauge
--
# HELP process_cpu_seconds_total Total user and system CPU time spent in seconds.
# TYPE process_cpu_seconds_total counter
--
# HELP process_max_fds Maximum number of open file descriptors.
# TYPE process_max_fds gauge
--
# HELP process_open_fds Number of open file descriptors.
# TYPE process_open_fds gauge
--
# HELP process_resident_memory_bytes Resident memory size in bytes.
# TYPE process_resident_memory_bytes gauge
--
# HELP process_start_time_seconds Start time of the process since unix epoch in seconds.
# TYPE process_start_time_seconds gauge
--
# HELP process_virtual_memory_bytes Virtual memory size in bytes.
# TYPE process_virtual_memory_bytes gauge
--
# HELP process_virtual_memory_max_bytes Maximum amount of virtual memory available in bytes.
# TYPE process_virtual_memory_max_bytes gauge
--
# HELP rest_client_requests_total Number of HTTP requests, partitioned by status code, method, and host.
# TYPE rest_client_requests_total counter
--
# HELP vcert_http_in_flight_requests A gauge of in-flight requests being made using vcert.
# TYPE vcert_http_in_flight_requests gauge
--
# HELP workqueue_adds_total Total number of adds handled by workqueue
# TYPE workqueue_adds_total counter
--
# HELP workqueue_depth Current depth of workqueue
# TYPE workqueue_depth gauge
--
# HELP workqueue_longest_running_processor_seconds How many seconds has the longest running processor for workqueue been running.
# TYPE workqueue_longest_running_processor_seconds gauge
--
# HELP workqueue_queue_duration_seconds How long in seconds an item stays in workqueue before being requested
# TYPE workqueue_queue_duration_seconds histogram
--
# HELP workqueue_retries_total Total number of retries handled by workqueue
# TYPE workqueue_retries_total counter
--
# HELP workqueue_unfinished_work_seconds How many seconds of work has been done that is in progress and hasn't been observed by work_duration. Large values indicate stuck threads. One can deduce the number of stuck threads by observing the rate at which this increases.
# TYPE workqueue_unfinished_work_seconds gauge
--
# HELP workqueue_work_duration_seconds How long in seconds processing an item from workqueue takes.
# TYPE workqueue_work_duration_seconds histogram